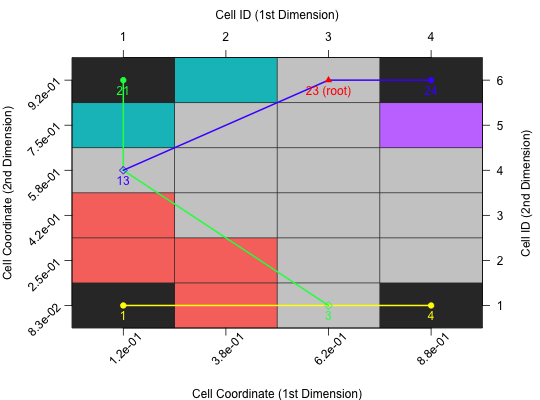
Plot Barrier Tree in 2D
Creates a 2D image containing the barrier tree of this cell mapping.
plotBarrierTree2D(feat.object, control)
Arguments
| feat.object | [ |
|---|---|
| control | [ |
Value
[plot].
A 2D image, visualizing the barrier tree of this cell mapping.
Details
Possible control arguments are:
Computation of Cell Mapping:
gcm.approach: Which approach should be used when computing the representatives of a cell. The default is"min", i.e. the observation with the best (minimum) value within per cell.gcm.cf_power: Theoretically, we need to compute the canonical form to the power of infinity. However, we use this value as approximation of infinity. The default is256.
Plot Control:
bt.cm_surface: Should the underlying surface be based on a cell mapping plot (default isTRUE)? Alternatively, the cells would be coloured in shades of grey - according to their objective values.bt.margin: Margins of the plot as used bypar("mar"). The default isc(5, 5, 4, 4).bt.color_surface: Color of the surface of the perspective plot. The default is"lightgrey".bt.color_branches: Color used for the branches of the barrier tree. Per default there will be one color per level.bt.pch_root: Symbol used for plotting the root. The default is17(filled triangle).bt.pch_breakpoint: Symbol used for plotting a breakpoint. The default is5(non-filled diamond).bt.pch_basin: Symbol used for plotting the leaf (i.e. a basin) of the barrier tree. The default is19(filled circle).bt.col_root: Color of the root symbol. The default is"red".bt.lwd: Width of the lines used for plotting the branches of a barrier tree. The default is2.bt.label.{x, y}_coord: Label of the x-/y-coordinate (below / left side of the plot).bt.label.{x, y}_id: Label of the x-/y-cell ID (above / right side of the plot).
Examples
# create a feature object
X = createInitialSample(n.obs = 900, dim = 2)
f = smoof::makeAckleyFunction(dimensions = 2)
y = apply(X, 1, f)
feat.object = createFeatureObject(X = X, y = y, fun = f, blocks = c(4, 6))

# plot the corresponing barrier tree
plotBarrierTree2D(feat.object)